Process diagnostics support process improvements and optimization
In the third installment of this series on advanced diagnostics, we will take a deeper dive into process diagnostics. As a quick review:
- In the first installment, we provided an overview of instrumentation diagnostics, with five ways they are used in process manufacturing environments.
- In the second installment, we focused on device diagnostics and what an instrument can tell us about its own condition.
Now we will examine what an instrument can tell us about what is happening in the process beyond the basic process variable, including three specific examples. All relate to pressure measurements because these examples are all relevant for a variety of other measurements, including flow and level. The common element is that they all look at process “noise” and how this conveys actionable information if carefully analyzed. To be clear, noise in this case does not mean audible sounds that a technician might hear walking around the plant. We will instead focus on something more quantifiable that can be incorporated into automated control strategy.
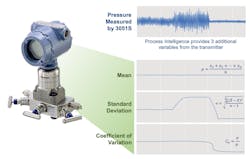
Noise in this context is the differences in readings when measured at very short intervals. We are used to seeing jagged lines on displays in a control room from a flowmeter or pressure transmitter, but if examined through a magnifier, the lines are more jagged than we can see. For example, instruments based on Emerson’s Rosemount 3051S pressure transmitter take readings 22 times per second. Its transmitter electronics can process data that quickly (Figure 1) and perform statistical process modeling in real time to provide its Process Intelligence diagnostic. This is what we mean by noise. The basic process variable, say a simple pressure measurement, may be steady as a rock when viewed on a control room monitor, but noise level details may be telling a deeper story.
So how do we interpret data created by this capability? Let’s look at three situations where Process Intelligence can help plant personnel improve operations.
Plugged impulse lines
The most common application for Process Intelligence is detecting plugged impulse lines. This can occur in any type of pressure application, and it is frequently associated with differential pressure (DP) flowmeters (Figure 2). Such installations typically use a DP transmitter with impulse lines running to taps on either side of the primary element, which creates a pressure drop. For an accurate reading, both lines must be clear of obstructions to show the true pressure readings necessary to calculate the flow.
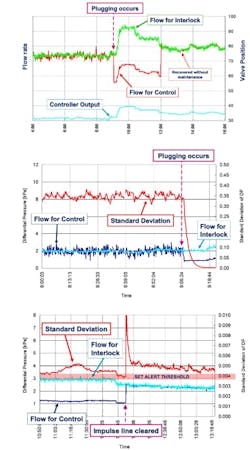
The usual cause in these situations is solids in the fluid flow that lodge somewhere in the lines. A plugged impulse line can corrupt the reading, either sending it high, low, or simply locking it where it is — despite actual pressure changes (Figure 3).
The first diagram (Figure 3 top) shows a typical case. One of the impulse lines clogs at just after 9:00, causing the control reading to drop suddenly. (The “flow for interlock” line is a second flowmeter on the same line providing a parallel reading for mechanical functions, and it is unaffected by the blockage.) The automation host system responds as it is programmed, opening the valve to compensate. This sends the flow well beyond the setpoint. At 12:00, the blockage clears spontaneously, and the automation host system closes the valve to bring the flow back in line. This may have caused an upset elsewhere in the process. So how does Process Intelligence help?
The second diagram (Figure 3 middle) shows what Process Intelligence would indicate in a similar situation. When plugging occurs, the standard deviation drops, even though the actual flow reading has not changed. The logical cause is a plugged impulse line, which is now recognizable in seconds.
The third diagram (Figure 3 bottom) shows how response to this condition can be automated. The automation host system has a threshold defined, and if the standard deviation crosses the limit, it triggers maintenance to investigate and clear the clog. Once this condition is cleared, the automation host system can bring the flow back to the desired setpoint, in agreement with the second flowmeter.
Level measurement detecting agitation loss
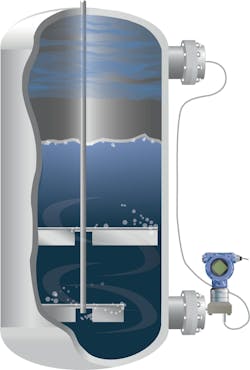
Pressure transmitters are very versatile for measuring liquid pressure using simple pressure (vented tanks) or DP (pressurized tanks). Looking for process noise in this context might seem something of a stretch since quiescent liquid in a tank should not generate noise. On the other hand, many batch processes use an agitator (Figure 4) during processing cycles, or even storage, to keep components from settling.
If the agitator is working properly, spikes in the standard deviation measurement should show a rhythm corresponding to internal pressure pulses created by the agitator rotation. The automation host system can be programmed to monitor those pulsations, both in amplitude and frequency as any deviation of amplitude may indicate impulse line plugging, and frequency deviations suggest problems with the agitator motor. If all the control room sees is the level reading, operators will not be able to recognize either of these problems developing.
Distillation column flooding
This is a complex problem, but the limitations of this article’s length only allow a brief explanation. Distillation columns that use some form of structured packing, or even trays, depend on maintaining a balance of reflux liquid flow falling down from the top, against a counter flow of vapor from the bottom driven by a reboiler. The vapor flowing up should slow the downward liquid flow, but still allow it to move freely. If the vapor flow is too great, it can cause liquid to start backing up (incipient flooding), eventually stalling the flow in both directions (runaway flooding).
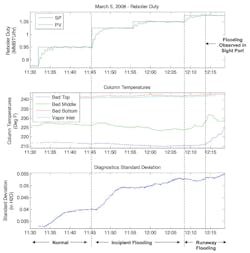
This condition is not easy to detect in the control room, and many operators discover it by seeing it happening via a viewing port, or via changes to expected temperature readings at various levels. These methods may work but often take a long time, and a high level of operator expertise, to be realized. A more reliable method is to take DP readings at strategic levels over the column’s height as flooding can disrupt DP readings from a lower point to a higher point. While this indicates the problem sooner than a temperature change, it also requires the problem to be well advanced before it is detectable. Process Intelligence is the answer because it is the fastest way to detect when the problem is forming, before a major blockage.
The interaction between vapor and liquid creates specific noise patterns detectable by the DP transmitter when it has Process Intelligence capabilities (Figure 5). When liquid begins to build up and blocks vapor flow, the standard deviation begins to climb rapidly, ahead of the change in DP and far ahead of changes in temperature. Even if an operator is watching through a sight port, Process Intelligence is faster because it will warn of incipient flooding as soon as the standard deviation line turns upward.
Process Intelligence provides the first indicator of incipient flooding and is almost immediate. When operators are aware of this measurement and understand its meaning, they can compensate before the problem becomes too serious.
Utilizing Process Intelligence
Process diagnostics, like all diagnostic capabilities, are present in many types of instruments. The common element is that facilities must make the effort to utilize them for their benefits to be realized. When considering the cost of a process upset due to a clogged impulse line, or a major drop in distillation efficiency due to flooding, the money and engineering effort required to implement these capabilities can be earned back in a very short time. There are many more opportunities to take advantage of advanced diagnostics, and Emerson can support end users as they investigate new and unique ways Process Intelligence can deliver overall process improvements. Emerson has been in the forefront of diagnostics development and remains an effective partner for the products and know-how required to realize these gains.
About the Author

Kelly Albano
Product manager for Emerson Coriolis transmitters and software at Emerson
Kelly Albano has been with Emerson for over 12 years and is a product manager for Emerson Coriolis transmitters and software. She is focused on improving user experiences and guiding users through digital transformations. Albano holds an undergraduate degree in Environmental Engineering from University of Colorado at Boulder, and an MBA with a Marketing Management Certificate from Colorado State University.


