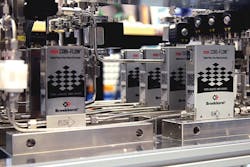
When it comes to accurately measuring and controlling flow rates in the range of 1 gram per hour (g/h) and lower, not only is a good mass flow controller essential, but proper design and the other important components come into play. Any system will only be as strong as its weakest link.
For controlling low flow rates, the weakest link is usually not the mass flow sensor. A mass flow controller is capable of accurately measuring and controlling the flow rate at its position in the system. However, no absolute confidence exists that this flow rate is accurate further up- or downstream of the flow controller. If no countermeasures are taken, the exact desired flow rate will not be delivered to the process. As the flow rate minimizes, the relative internal volume of system components such as piping, filters and valves seems to increase. This affects the dynamics of the system since the response time will slow down, resulting in a loss of direct control. When a set-point is given and this is assumed to reach the process, expectations might not be met.
For instance, a popular setup to force flow through the system is to make use of pressurized gas. However, gas will dissolve in the liquid to a saturation level proportional to the gas pressure. The dissolved gasses appear again as bubbles downstream in the system where the pressure has decreased. If a gas bubble passes the flowmeter or valve or enters the process, it disturbs the stability of the flow.
Practically for low flow rate processes, it is sometimes hard to understand why and when the system works correctly. Many questions arise. Is the purity of the media correct? Are the process temperatures as they should be? Is the set rate or dosage correct? Is the pressure stable?
Challenges in low-flow process
For the lowest flow rates it is hard to verify if, at any time, the flow entering the process is as expected. As mentioned, various underlying causes are possible:
- Dissolved gasses in the liquid and uncontrolled gas bubble entrapment and release
- Dynamic effects of multiple fluid transmission lines, e.g., in medical multi-infusion systems
- Compliance of the system, e.g., in plastic tubing or plastic syringes
- Local heating and fluid expansion caused by the internal volume and power dissipation of solenoid valves
- Ripple on the flow delivery when using pumps
This article focuses on the influence of dissolved gasses in the liquid and the possible countermeasures.
When dissolved gasses in the liquid undergo a pressure drop through the system, gas bubbles tend to appear. The bubbles not only cause discontinuity in the flow but also tend to change the flow rate in between the gas bubbles. Several experiments have been carried out to investigate the phenomena and match it with known theories.
Low-flow experiment with Coriolis mass flowmeters
Figure 1 shows a setup of two low-flow Coriolis mass flow instruments in series. The first instrument is a mass flowmeter. The second instrument acts as a controller, controlling the flow with an onboard, proportional piezo valve positioned in front of its sensor.
In this specific case, the fluid is pressurized using compressed air to force the liquid through the system. As the pressurized air comes in contact with the liquid, it will dissolve into the liquid proportionally to the gas pressure. This experiment is to investigate the influence of dissolved gas in the liquid and the use of a degasser as a countermeasure for gas bubbles.
Without degasser
Figure 2 shows the outcome of the experiment when the setup has run for a few hours without a degasser. The effect of gas bubbles passing the sensor of the flow controller is clearly visible. This can also be seen in the density measurement of the second instrument. The density drops each time a gas bubble passes the instrument. The density is directly measured by the Coriolis instrument. A Coriolis instrument is capable of measuring density by a change in natural frequency of its vibrating measuring tube when liquid flows through it.
As expected, the gas bubbles are generated by the valve in the mass flow controller because the pressure drop occurs there. Since this valve is in front of its meter (in Instrument 2) the mass flowmeter detects the gas bubbles and the mass flow controller responds to it by controlling the valve.
Another remarkable phenomenon is that a difference exists between the measured flows of both devices. Instrument 1 (mass flowmeter) shows a lower flow rate of about 3 percent less than the flow rate measured by Instrument 2 (mass flow controller).
An explanation for this is that a generated bubble downstream of the control valve causes the volume flow to expand and push the liquid forward. Because the mass flow controller will maintain its set-point value of 1 g/h, the flow rate is slowed down to maintain the correct mass flow. Therefore, the flow rate through the first flowmeter is 3 percent less in between the bubbles.
A difference in volumetric flow rate before and after the appearance of the gas bubbles also occurred. However, the average mass flow rate in the instruments in both experiments is within specification and thus the same, as shown in Table 1. This table shows the average deviation from 1 g/h of each instrument in both experiments over the entire data set, as shown in Figures 1 and 2.
The 3 percent error matches Henry’s law, which says that the solubility of air in water is 22 milligram per liter, per Bar. If this number is divided by the density of air, the volumetric expansion explains the 3 percent increase in volume flow after the gas bubbles appear.
Countermeasures for gas bubbles
To take out the dissolved gas before problems appear, a high-performance liquid chromatography (HPLC) degasser is used. This device uses a permeable tube to degas the liquid. The permeable tube is positioned inside a vacuum chamber where the vacuum is maintained by a small, onboard vacuum pump. The device extracts most of the dissolved gasses in the used liquid.
Furthermore, because the liquid is well-degassed, it is capable of easily dissolving any remaining small bubbles left behind in the system. The system will end up fully filled with liquid without any gas pockets. Since gasses are compressible, a properly degassed system makes the system stiff and responsive. A system like this can generate a continuous and stable flow toward the process with good control behavior.
With degasser
Figure 3 shows the measured outcome where the degasser is put up in front of the Coriolis mass flow instruments. It is clearly visible that the system can run for several hours without any drops or glitches in mass flow or density. No air bubbles are present in the system or generated by the control valve. The small deviation between the instruments is within the specified accuracy of 0.2 percent of reading ±20 milligrams per hour, zero stability.
Conclusion
A conclusion that can be drawn from this experiment is that it is recommended to use a degasser for generating a continuous, stable and responsive system toward the end process, especially in low-flow liquid measurements. An ideal solution for these low-flow measurements would be a degasser in combination with a mass flowmeter/controller, as is used in this experiment. Because the mass flow controller’s control valve is in front of the meter, the sensor is capable of monitoring the actual flow in the system. This results in optimal and direct process control. The instrument can be used for ultra low-flow applications up to 200 g/h.


