Trusted measurements help ensure performance, part 1
"Trusted” is the most important requirement for a measurement. Every component in an automation system is important, but the user is usually aware of a poorly operating control system or final control element because the measurement tells them. Unless the user has another independent means to check the measurement, the control system may strive to maintain the process at the wrong value. The allocation system may over- or under-bill or the plant may operate unsafely, sometimes for years.
It is not difficult to determine which measurements are trusted after a plant is running. Does the operator ever feel the need to (manually) double-check the reading? Are control loops that use the measurement always operated in automatic? Engineers tasked with selecting new devices want them to be trusted, so they write specifications that define normal operating and environmental limits. Purchasing verifies that the devices being selected are compliant. While it is important to ensure that a given device will provide the needed performance — accuracy, repeatability, reliability and response time when operating within expected limits — it is also important to ensure that the measurement will be trusted over the long term in all situations. To do this, the user must also consider the following:
Robust: How bad can the measurement get when things go wrong? What happens to performance when the operating or environmental conditions stretch, even briefly, beyond expected limits? Does a measurement that is normally ±x become ±2x or even ±10x? Doubling of uncertainty will cause a loss in efficiency, productivity or safety that may be tolerable over a short duration. Uncertainty of 10 times normal can — within a few hours — cause losses exceeding the value of the meter itself.
Verifiable: In evaluating performance within and beyond normal operating limits, users assume all the components of the measurement system are working correctly. How can the user know this is the case so the control, billing or safety system will never rely on a bad measurement? Even better, can the device provide early warning so the failure can be prevented?
Hopefully, it is not controversial to expect that most devices provided by reputable suppliers are compliant with their published specifications. Users may reasonably question how a supplier verifies specifications that cannot be individually tested on the actual devices being supplied, such as over-pressure protection or long-term stability. It is also true that some suppliers provide a better-quality experience — fewer out-of-the-box failures, better documentation and user interface, more robust devices that last longer, and better local service and support. While these are important, little general guidance can be offered to the user to help evaluate or quantify these prior to purchasing. Users must rely on their own personal and site experience with the devices and suppliers, supplemented by good record-keeping and perhaps factory tours to observe the devices being made and the people who make them.
Instead, this article and next month’s article will focus on helping the engineer ensure, prior to installation, that a measurement will be robust and verifiable. To ensure robust measurement performance, identify potential faults and worst-case operating limits, quantify the impact on the measurement certainty and then apply best practice design to ensure “good enough” performance when operating outside of these worst-case limits. Since many users rely on redundancy for critical applications, engineers should pay special attention to “common cause” problems that can affect multiple measurements.
Best practice design to ensure robustness
Even though most devices are compliant to specifications when first supplied, device performance — accuracy, drift, responsiveness, etc. — is usually specified under reference/laboratory conditions. This is because published device specifications are established and certified by a third-party laboratory in a clean room environment with controlled ambient temperature, low humidity and vibration. It should not be surprising that, under these benign conditions, most devices provide extremely good performance and reliability. Unfortunately, most devices are installed in real-world conditions where they will experience widely variable temperatures, high humidity and vibration, and exposure to harsh chemicals. Users may not expect the same performance under real-world conditions but often assume performance to be “good enough” to allow for only slightly degraded process performance. Unfortunately, this is often not the case.
For an orifice or other differential pressure (DP) flowmeter that uses Bernoulli’s Principle, the DP generated across the plate varies with the square of the flow rate. This means that when flow is 10% of full scale, the DP becomes 1%, so a small error in full-scale pressure reading — due perhaps to drift or changing ambient temperature — can cause large flow errors since its impact is magnified 100 times.1 Even if the user is not aware of it, this magnified uncertainty in the measurement at low-flow conditions may be what limits the usefulness of the automation system. How close to the surge line can a compressor be run2? What is the lowest flow of fuel into a boiler in low-fire3? What is the lowest flow that should be counted by the totalizer of the allocation meter? For these applications, the user should work with the supplier to quantify and, where possible, characterize/optimize the device to ensure robust real-world performance under all possible operating and environmental conditions.
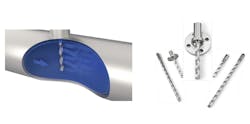
When engineering a temperature measurement, users rely on the wake frequency calculation (WFC) to ensure that the thermowell will not resonate under normal flowing conditions, which can lead to breakage and loss of containment.⁴ The risk, of course, is that future flow conditions may change, either during upset conditions or longer term, causing resonance and eventual failure. A less obvious risk is to the measurement performance. The most common design practice when a thermowell fails the WFC is to make the thermowell shorter. This can allow the user to avoid the resonance frequency and minimize the risk of breakage. It also sacrifices the measurement whenever the temperature at the center is significantly different from the temperature nearer the pipe wall, as can happen when flow rate is low, when fluid viscosity is high or with larger pipes. Instead, users should install a “twisted” thermowell, fully inserted to the center of the pipe. This design avoids resonance and risk of wake frequency breakage while providing robust temperature measurement over all operating conditions (Figure 1).
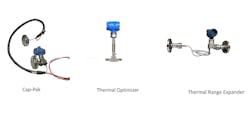
Low temperatures cause some fluids to become viscous and slow responding. This can affect the silicone fill fluid in a pressure transmitter, plus any piping/tubing or capillary that connects the transmitter to the process (Figure 2).
Users also often underestimate the rate of heat dissipation in a real installation. In a northern climate, fluid cooling can cause response time to vary from 1 second in summer to 60 seconds in winter⁵, even with insulated lines. In critical applications where redundancy is used, all transmitters are connected using a similar length of capillary or piping. This means all will suffer from the same common cause of slowed response, yet will still agree with each other, so the user may not become aware of the problem. This can lead to “seasonal trust” — often observed in northern climates — where operators run some loops in manual in the winter then return to automatic control for the summer. The robust solution is to quantify the rate of heat dissipation under all installed conditions and either control fluid temperature using a heater or a thermally optimized seal system to reduce life-cycle cost.
Conclusion
These are just a few examples of how a measurement can be robustly designed to provide “good enough” performance when operating outside of expected process and environmental limits. To gain maximum benefit, the engineers and technicians available to the user must have the tools and skills needed for selection, initial installation and setup, and ongoing maintenance. Users should evaluate the engineering tools provided by the supplier, as well as the availability and competence of their pre-sales application engineering and after-sales support. Users will require training, of course, but they should also maximize familiarity through commonality. A new device, unproven in a given facility, may provide some interesting new feature or lower acquisition cost, but increased training and inventory costs or errors made during installation, setup or maintenance can quickly erase those benefits. With any new technology or practice, commonality and familiarity will, over time, create a proven track record and build trust.
References
- Menezes, M., “When Your Plus and Minus Doesn’t Add Up,” Flow Control, January 2005.
- Menezes, M., “Improve Compressor Safety & Efficiency with the Right Pressure Transmitters,” Control Solutions, November 2001.
- Nogaja, R., Menezes, M., “Reduce Generating Costs and Eliminate Brownouts,” Power Engineering, June 2007.
- Bonkat, T., Kulkarni, N., “A Tool to Simplify Thermowell Design,” Process Heating, October 2019.
- Menezes, M., “New Measurement Practices for Cold Climates,” Chemical Engineering, August 2015.
- Barhydt, P., Menezes, M., “Energy Management Best Practices and Software Tools,” Energy Engineering, April 2005.
- Patton, T., “Handling Entrained Gas,” Flow Control, September 2010.
- Chemler, L., “Tough slurry processes require quality measurements,” Flow Control, October 2019.
- Serneby, I., “How frequency modulation can improve effectiveness of radar level measurement,” Flow Control, August 2019.
- Baker, W., Pozarski, R., “Overcoming flow measurement challenges,” Control Engineering, December 2015.
Mark Menezes manages the Canadian Measurement & Flow business for Emerson Automation Solutions. He is a chemical engineer from University of Toronto, with an MBA from Kellogg-Schulich. Menezes has 31 years of experience in industrial automation, including 24 years with Emerson.
