Trusted measurements help ensure performance, part 2
Trust is vital for measurements; if the measurement is wrong, the system might operate the process at the wrong value, sometimes for years. Part 1 of this series described how a robust measurement builds trust since it remains “good enough” even when stretched beyond expected operating and environmental limits. However, even a measurement that is robust when first commissioned can eventually degrade or fail with unpredictable impact. A verifiable measurement remains trustworthy for the long term since it allows the user to know when degradation is happening, so the control, billing or safety system will never rely on a bad measurement.
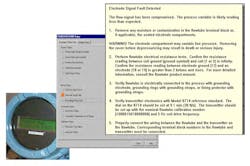
In control applications, verification allows the user to minimize impact to safety, efficiency or quality. In billing or accounting applications, the user can minimize billing disputes and the resultant extra labor and demands for retroactive compensation. In safety/SIS applications, the user can improve process safety and simplify partial proof-testing, which minimizes cost and risk. The key tools for verification are diagnostics located in the transmitters, which have access to the raw, undamped signals at the sensor. In some cases, diagnostics can predict when a gradual degradation will — if not corrected — eventually cause the measurement to completely fail. To facilitate this predictive maintenance, diagnostic messages and recommended remedial action should be communicated via smart digital protocols (HART, WirelessHART, Fieldbus) to a central asset management (computer) system. Examples of verification diagnostics, including screens from the asset management system, are provided here.
Verification via redundancy and diversity
When high trust is required, redundancy can help, since a second measurement can be used to verify the first. The user still needs to apply good design and additional diagnostics, because many real-world failures are “common cause” so they can impact multiple, redundant devices. One way to avoid common cause is to apply diversity, where the user compares the outputs of two devices that use different technologies. For example, back up a DP level meter with a radar level meter; back up a DP flowmeter with a vortex meter. While one is not necessarily better than the other, a fault that affects one should not affect the other and vice versa. Of course, redundancy has an obvious downside: installing and maintaining two devices is expensive, even more so when the technologies are diverse.
One case where redundancy can be added at minimal cost applies to temperature sensors. Most temperature measurements fail due to the sensor, since — unlike the transmitter — it is directly exposed to the hostile process conditions. The engineer can specify a transmitter that can connect to two independent sensors and automatically select or average between the two. Since a single transmitter is used with no additional field wiring, incremental cost is minimal. If the two sensors also share a thermowell, the signals from the two sensors should be (nearly) identical, so the transmitter can use a deviation alarm to verify both continuously. This provides extremely high trust in the measurement with minimal up-front cost. It also eliminates the need for routine, periodic “ice bath” sensor tests.
Verification via diagnostics
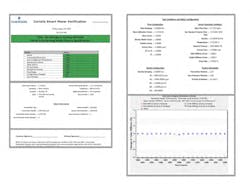
Smart meter verification is often used for billing and regulated applications. Upon factory or initial field setup, the meter electronics measure and record baseline parameters. It remeasures those parameters — on demand or continuously during normal operation — and alerts the user when changes in a parameter might affect performance. The specific parameters monitored depend on the technology and could include, for example, tube stiffness in a Coriolis meter1, field strength in a magnetic flowmeter2 or time period in an insertion densitometer or viscometer. When combined with other diagnostics, such as checks of electronics, zero stability or electrode integrity, verification ensures the device is working correctly and provides early warning when it is not. In a regulated application where periodic verification is required, smart verification is safer and less expensive than traditional, manual alternatives that require the use of external test or proving equipment. It is also more reliable and trustworthy since it does not rely on technician judgment and manual record-keeping.
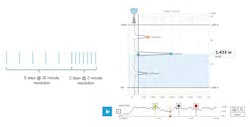
Verification tells the user that a measurement can be trusted. It also gives maintenance a powerful tool if operations does not share that trust, common with intermittent problems. The smart transmitter has access to a wealth of high-resolution, raw sensor data, which it summarizes for the operator into a single process variable (PV) stored in the historian. If the operations log contains an entry like “measurement was behaving strangely at 10 p.m. last night,” the maintenance technician can “go back in time” and review the original high-resolution data the transmitter had access to at the time of concern.
For a Coriolis meter, this might be the same operating parameters — plus any diagnostic logs — used for verification. For a radar level meter, it might be the echo plot, which shows all the reflections the radar sees at a moment in time, not just the one peak it judges to be the PV. These files can be forwarded to the supplier for further expert analysis. That way, a suspected intermittent problem can be confirmed, and its root cause(s) identified and corrected, so the problem does not happen again, this time with severe consequences.
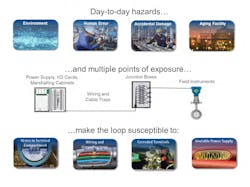
Diagnostics can alert the user to failures that might never be uncovered except during infrequent manual proof-testing. For example, consider a transmitter that normally operates with an output in the range of 4-16 mA, where only a rare, dangerous process condition would drive output above 16 mA. How would the user know if the power supply, wiring or terminations are faulty, so the transmitter is physically unable to drive the output above 16 mA? Most users check periodically with a manual, offline proof-test. A better approach is a continuously operating power diagnostic. The automatic diagnostic is simpler and more cost effective. It is also more sensitive, since it can detect intermittent failures and brownouts that might occur between manual tests and often precede permanent failure of electronic components3.
Similar concerns apply to switches. Consider a high-level switch that might not be exercised for years. How would the user know if the switch itself has failed? As with the power supply example, the user would need to either manually check the switch on a periodic schedule or use a continuously operating switch diagnostic that checks the vibration frequency of the forks. The manual inspection “bucket test” requires the switch to be removed from the vessel, with obvious cost and safety concerns. Since the automatic diagnostic can be run while the forks are installed inside the vessel, it not only provides higher safety but also leads to greater trust since it can be run much more frequently.
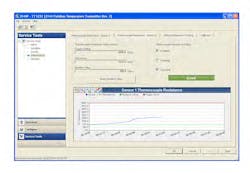
Diagnostics can not only detect when a measurement is degraded but also extrapolate a gradual degradation to predict complete failure. For example, when connected to a thermocouple, the transmitter measures voltage to determine temperature. Thermocouples and thermocouple wiring are fragile and degrade over time. If the thermocouple or wiring breaks, the reading will change but remain “on scale” — within the normal operating range — so the user might not become aware they are operating on a wrong value.
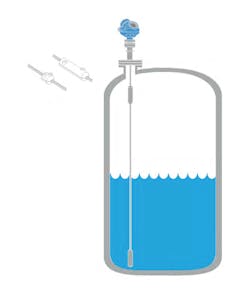
If the same transmitter were set to measure not only the voltage but also the resistance of the thermocouple/wiring, a sharp increase in resistance would alert operations to immediate failure, while a slow upward trend in resistance could help maintenance predict and prevent future failure4. Similarly, with radar level, coating of the antenna or probe causes a reduction in signal strength. With enough coating, the level can be lost entirely. By monitoring and trending the signal strength, the user can predict and prevent the failure by scheduling a cleaning of the antenna or probe. These diagnostics improve trust, while minimizing the need for regular preventive inspections or proof-tests.
Some diagnostics take advantage of the known physics of the process. For example, it is usually not physically possible for the output of a temperature sensor installed inside a thermowell to change more than 25% of full scale in less than a second, even during an extreme event. Knowing this, the user can configure the transmitter to validate each measurement and ignore/suppress measurements that change unrealistically between readings. This is especially useful in temperature applications where electrical noise such as EMI and RFI can cause dropouts and spikes in the reading. When the transmitter judges a signal to be invalid, it simply repeats the last good measurement. This ensures stability while avoiding the need for damping, which slows response time. The other benefit of validation is that the transmitter can track how often it needs to suppress an input. With many electrical components, a gradually increasing rate of dropouts/spikes can predict eventual complete failure. Note that this approach is only applicable to signals that can only change slowly, not those that can realistically change very quickly during an extreme event, for example, pressure or flow.
Applications in safety instrumented systems (SIS)
While the aforementioned examples apply to any measurement, verification takes on special importance in a safety/SIS application given the severe consequences of failure. For this reason, devices designed for SIS usually incorporate additional diagnostics that detect internal electronic failures5. These diagnostics are usually not configurable by or accessible to the user, but when they detect an internal, dangerous failure, they automatically force the device to a safe state. This provides higher safety, allowing the device to be validated or certified by third-party safety laboratories to specific safety integrity levels (SIL). While in theory, a SIL 2/3 device should provide a very trustworthy measurement, particularly if redundant, the engineer still needs to apply good design and diagnostics to avoid real-world, common cause failures.
Enabling technologies
As previously noted, diagnostics are best run in the transmitters themselves where they have access to the raw, high frequency sensor signals. However, to make these diagnostics more useful, the user should not need to rely on operators and maintenance technicians in the plant to look at transmitter displays. Important diagnostic information should be communicated back to the control room and/or maintenance shop using a digital protocol and then prioritized and presented in a user-friendly format at an asset management station. The asset management system should also automate maintenance records and provide recommended remedial action(s) to speed troubleshooting.
References
- Menezes, M., “SIS: Applying measurement best practices,” Control Engineering, February 2017.
- O’Banion, T., “Verifying Coriolis flow meter calibration,” Flow Control, May 2016.
- Wiens, M., “How to use process diagnostic capabilities in pressure transmitters to improve plant performance,” Processing, November 2019.
- Weimert, M., “Leverage diagnostics to keep production running smoothly,” Hydrocarbon Processing, November 2013.
- Brown, S., Menezes, M., “SIS: Focus on Measurement Diagnostics,” Chemical Engineering, August 2013.
Mark Menezes manages the Canadian Measurement & Flow business for Emerson Automation Solutions. He is a chemical engineer from University of Toronto, with an MBA from Kellogg-Schulich. Menezes has 31 years of experience in industrial automation, including 24 years with Emerson.
