I recently attended the Pump Users Symposium. The exhibits showed the latest technology to improve efficiency and conserve energy with pumps and pump systems. The tutorials discussed the latest developments in computer-aided design to produce high-efficiency motors, pumps, valves, and pipe schemes.
The lessons were simple for today’s “designed-obsolescence,” instant-gratification society. Just buy your way to improved efficiency. Scrap all your fixed-speed electric motors and replace them with high-efficiency variable-speed motors. Toss your existing process pumps, and buy new high-efficiency pumps at a quarter-million dollars each.
Twenty years ago, this same symposium would have shown the pump users how to improve their installed equipment. The experts in the tutorials were oozing and dripping with useful knowledge. Now the symposium teaches that all energy-saving solutions lie in new devices and new technology. This is simply not true. To the contrary, I will explain here how you can conserve huge quantities of energy with no investment in new equipment.
Consider Japan
A huge earthquake struck Japan just over a year ago (March 2011). The quake damaged the Fukushima Nuclear Power plant. At first, the Japanese government considered rebuilding the nuclear plant. Japan has more experience with both sides of nuclear power than any other country on earth, beginning with the atomic bomb that ended World War II.
Two months later (May 2011), after much consideration and reflection, Japan announced it would abandon plans to rebuild the Fukushima plant. Japan would make-up the lost production capacity with conservation and renewable energy as pillars of a new energy policy. Energy conserved is energy found.
With pumps, opportunities to conserve energy stare us in the face every day, but we don’t see them. We are like wild deer at night, transfixed by the spotlight of new technology. Our attention is distracted by the spotlight, and we don’t see the hunter’s rifle.
Save Energy On the Cheap
Let me offer the least expensive method to bring about the greatest energy savings with process pumps. If you follow my suggestions, you’ll invest a few hours to improve the education of your employees and realize the greatest energy conservation for your company, your country, and the world. I’m going to offer some thoughts on the way pumps are operated.
You don’t need a license to own a car. You don’t need a license to repair a car. You need the license to “operate” the car.
The driver (operator) determines if the car is fuel efficient, or a fuel guzzler. The driver determines if the car is a high-maintenance vehicle, or a low-maintenance vehicle. The driver influences the ultimate service life of the vehicle.
Likewise, a pump operator determines the efficiency of the pump by the way he controls (operates) his pumps. The pump operator determines whether the pump is low maintenance or high maintenance. And the operator determines the ultimate service-life of the pump.
But strangely, most pump operators, and even their supervisors and engineers don’t know how to control their pumps. This is a strong statement, deserving an explanation.
Consider Cavitation
All over the world, cavitation is the most common maintenance issue with the process pump. Cavitation is the root cause for about 70 percent of all pumps in the shop today around the world. Often, we don’t attribute the problem to cavitation.
The production engineer sent the pump to the shop because he perceived the pump was performing “off-the-curve.”
- We think the pump is in the shop with mysterious mechanical seal failure. Mistakenly, we blame the seal or the seal supplier.
- We think the bearings failed prematurely. We mistakenly blame the shop fitter or technician who installed the bearings.
- The reliability engineer ordered to rebuild the pump to deal with runaway vibrations.
Most of these problems are not real failure modes. These complaints are typical symptoms and manifestations of cavitation.
By definition, cavitation is the formation and implosion of vapor bubbles inside the pump. Cavitation occurs when the prevailing pressure applied to the liquid falls below the liquid’s vapor pressure. A liquid will go into cavitation if the prevailing pressure is sufficiently low, or if the liquid’s temperature is sufficiently high.
Regarding pumps and process liquids, “classic cavitation” is a place (head and flow) on the pump performance curve. Amazingly, the pump operator can prevent 60 percent of all cavitation by simply avoiding that place on the curve. The operator can make 60 percent of all cavitation calm down (including the associated vibrations, bearing and seal failures).
The questions are:
- Does the pump have adequate instrumentation?
- Does the operator know how to interpret the pump curve?
- Does the operator know how to avoid that place on the pump curve?
A few liquids are cavitation prone, and sometimes the demands of production call for pump operation in the cavitation zone. These conditions are beyond the scope of the plant operator. Then the engineer can intervene and make even more problematic cavitation go away.
The questions are:
- Does the engineer know how to give instructions to the operators and instrumentation technicians?
- Does the engineer know how to modify the system to resolve cavitation?
- Does the engineer know what he’s trying to accomplish?
Sadly, these issues are not discussed in a university “Fluid Mechanics” course.
Why in 2012 is cavitation a misdiagnosed, mysterious, unknown phenomenon? Why isn’t cavitation eradicated like measles, polio, or dengue fever? Why can’t the process engineer resolve cavitation? Because he doesn’t understand how the pump and system interact.
Therefore, we’ve taught the pump operator to:
- Open the valve;
- Start the motor and pump; and
- Let the pump do what it wants to do.
You certainly couldn’t start your car, put the car in gear, and then let the car do whatever it wants to do. No one would say this is how to drive (operate) a car.
Pump companies publish performance curves of the different pump models they manufacture. The curves contrast head and flow and indicate the efficiency and power consumption at different points on the curve.
The pump’s efficiency is zero (zero percent efficient) on both ends of the curve. Between both ends, there are zones of better and best efficiency. Best efficiency is a place on the performance curve where the pump delivers the optimum combination of head and flow at the least energy consumption.
As the pump operates away from this primary zone of efficiency, energy is wasted or diverted from its primary mission. This diverted energy manifests itself as excessive power consumption, heat generation, noise, mysterious vibrations, and runaway maintenance. Think about it! Vibrations, noise, heat, and even “unplanned” maintenance are all forms of diverted or misdirected energy, drawn away from the primary mission.
In the hands of the operator, the production and reliability engineers, the pump curve is the most powerful indicator of energy conservation and overall equipment health. My experience indicates:
- That control room monitor screens don’t show the pump curve;
- That most operators are not trained to interpret their pump curves;
- That many engineers are unfamiliar with their pump curves; and
- That most engineers are unfamiliar with their system curves.
The laws of thermodynamics state: Energy is neither created nor destroyed. Energy is only transformed or converted from one form into another. Inefficiency occurs when too much energy is wasted by conversion into an “unusable” form.
When the pump operates to the left of best efficiency for extended periods, energy is transformed (wasted) into unusable:
- Heat generation—Kilowatts of diverted energy are converted into calories. A calorie is the energy to raise one kilogram of water one degree Celsius temperature. The pumped liquid overheats and may even vaporize.
- Mysterious vibrations and noise—This is transformed (unusable) energy that leads to overall equipment degredation. Vibrations and noise will destroy your pump reliability program.
- Shaft deflection—This is transformed (wasted) energy expressed as a radial hydraulic imbalance in the volute. It sideloads the shaft and impeller assembly. The imbalance is measured in “tons” (not pounds) of radial load. Premature seal and bearing failure is the result. Alignment also suffers through the coupling to the electric motor or other driver. The entire shaft may even fracture and break.
- Internal recirculation—A cavitation-type noise in the pump releasing violent, “unusable” energy shock waves against the impeller. These shock waves travel through the shaft to the fragile faces of the mechanical seal and proceed on to the bearings. Premature bearing and seal failures result.
When the pump operates to the right of best efficiency for extended periods, energy is wasted as:
- Excess power (kW) consumption—This can overload your motor. Fuses may burn repeatedly. Breakers may trip. The stress leads to premature motor failure.
- Cavitation—The liquid vaporizes in low-pressure zones inside the pump. As the liquid passes into zones of higher pressure, the vapor bubbles implode, releasing violent unusable energy at the pump internals.
- Shaft deflection—Unusable energy discussed earlier.
- Mysterious vibrations—Unusable energy discussed earlier.
In an effort to control the pumps within their best efficiency zones, most design engineers try to mate the pump’s best efficiency performance coordinates to the piping system’s energy demands. These demands are called the Total Dynamic Head (TDH) of the piping system.
The most important part of the TDH is the “D.” The pump operates in a “dynamic” system. Why? Because:
- Levels rise and fall in the vessels. Static head is dynamic.
- Pressures rise and fall in headers and tanks. Pressure head becomes dynamic.
- Valves are constantly manipulated.
- Velocity and friction losses are dynamic.
- Filters and strainers clog with dirt and debris. The resistance is variable.
- New equipment (check valves, restrictor plates, in-line mixers, temperature probes, filters and strainers) is added into the system after design.
- Changes occur with maintenance and repair.
- The system expands and contracts with the economy. New pipes and processes are incorporated into existing systems—and later removed.
- The system curve changes as the demands of the system change. These changes drag the pump away from best efficiency and into zones of wasted energy on its performance curve.
All pumps operate at the intersection of the system curve with the pump curve. With process pumps, it is better to think of the system curve as the wagging tail of a happy dog. The system curve is in constant movement.
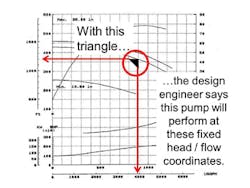
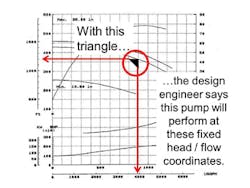
However, my experience indicates that too many design engineers treat the system as though it were static and fixed. Design engineers frequently show the proposed duty coordinates with a triangle superimposed onto the pump curve (Figure 1).
This leads process, production and reliability engineers to think the pump operates at only one specific set of head and flow coordinates. This is incorrect.
Process pumps operate in dynamic systems. This means the dynamic system will drag the pump into zones of wasted energy and high maintenance on the performance curve.
For example, let’s say you’re driving your car on a level highway. The road begins to slope downhill, and your car accelerates even faster. You don’t want to wreck your car or get a speeding ticket. As the driver (the operator of the car), you must aggressively take measures to control the velocity of your car. The car is equipped with an accelerator pedal, a brake pedal, a hand brake, and a transmission.
The driver must know how to use these devices to decelerate. Plus, the car has a steering wheel to avoid other cars and a horn and lights to alert other drivers.
Likewise, the pump operator has a number of devices at his disposal to hold (operate) the pump into the best efficiency zone, and deal with production upsets.
As the system changes, the pump operator can see the pump’s duty coordinates move away from the best efficiency coordinates by observing his instrumentation. The operator can manipulate the system’s elements to conserve energy and move the pump back toward the best efficiency zone.
The pump operator can manipulate his devices—tank levels, header pressures, valves, and other forms of resistance and artificial head…to control the pumps. This is the same way a car driver manipulates his tools—the steering wheel, the turn signals, the brakes, the accelerator pedal, the lights—to control his car as the roadway conditions change.
I have two children. They watched me drive for 16 years. I was the logical person to teach them and help them get their driver’s licenses. Likewise, the pump operators look to engineers for leadership.
The process engineer can train the operators in correct pump operation. The engineer can coordinate with design and maintenance to alter the system where appropriate, or expand the operating range of the pump. The goal is energy conservation and reliable pumps.
Here are some examples illustrating the operator’s contribution to energy conservation and reliability:
A common operation in a process plant is to use a pump to transfer liquid from one vessel to another. Typically, the liquid level in the suction vessel is below the liquid level in the discharge vessel. This elevation differential is called static head. Static head is one of the elements of the system curve.
If liquid is added to the suction vessel, or removed from the discharge vessel, the elevation differential decreases. As the elevation differential decreases, the pump’s duty coordinates (head and flow) slide to the right on the performance curve.
A flowmeter will indicate the increase in flow. Differential pressure gauges will indicate a drop in head or pressure as the pump moves toward the right on the curve.
This is a classic example illustrating how the dynamic system can drag a pump to the far right side on the performance curve.
Another typical operation in a process plant is to pump into a pressurized vessel or reactor. A process engineer may order to increase the temperature in the pressure vessel. The pressure in the vessel increases with the temperature. As the temperature rises, the backpressure will increase on the pump that feeds the vessel. This will drag the pump to the far left of best efficiency on the performance curve.
This typical function in a process plant illustrates how the dynamic system can drag a pump to the far left side on the performance curve. Most engineers are not aware that their decisions, without training or mentoring, cause runaway maintenance (bearing and seal failures) on the pumps.
Other common events in the process plant affect the pump such as:
- Installing new devices (like a heat exchanger) into an existing system, or
- Exchanging devices (valves for example) in a maintenance function, or
- Expanding the system (with more tanks and pipes), or
- A system upset (a leak, or equipment failure).
These alterations drag the pump away from best efficiency and hold the pump to the left or right extreme of the performance curve for extended periods. The operators look to the engineers for leadership to deal with these alterations.
Specific Energy
“Energy” is the capacity to perform work. “Work” is a force multiplied over a distance. “Power” is work per unit of time (work per second, work per minute). Specific energy is the energy per unit of mass, or energy comparison to perform equivalent work. With pumps, it is the energy (and ultimately the cost of energy) to move an equivalent mass (volume) of a liquid.
Let’s consider the specific energy and kilowatts of a typical raw water pump. We will use a comparison mass of 1,000 gallons of water that might be used at a municipal water plant, coal mine, or a petroleum refinery as we consider: How much energy is wasted when a water pump operates at 50 percent flow?
Let’s consider specific energy and kilowatts per 1,000 gallons of water (comparison mass). We will use a typical water pump that might be used at a water treatment plant or paper mill and consider: How much energy is wasted when a water pump operates at 50 percent flow?
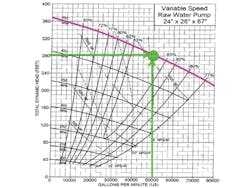
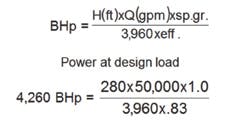
Let’s say the pump employs a fixed-speed motor with a pulley drive. The pump speed is 450 RPM. The pump is 83 percent efficient pumping 50,000 GPM flow at 280 feet of head (Figure 2).
At design flow (50,000 GPM) the pump is 83 percent efficient. The pump consumes 4,260 BHp by the formula:
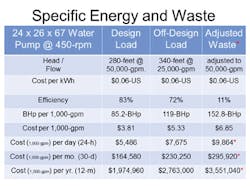
The Specific Energy is 85.2 BHp. This is the power (horsepower) required to deliver the comparison liquid (1,000-gallons of raw water) with this pump. Assigning a modest value of six cents per kWh, the cost to deliver 1,000 GPM is $3.51 U.S.
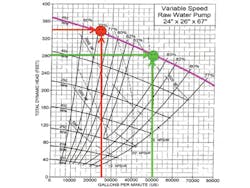
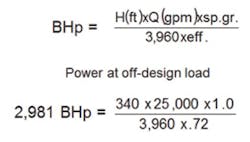
For whatever reason, a system alteration drags and holds the pump to 25,000 GPM flow. Efficiency drops to 72 percent with no intervention by either the engineer or the operator (Figure 3).
How much does the lost efficiency cost in wasted energy? At off-design flow (25,000 GPM), the pump is 72 percent efficient. The pump consumes 2,981-BHp.
The specific energy is 119 BHp. Again, specific energy is the power to deliver 1,000 gallons of raw water with this pump. At six cents per kWh, the cost to deliver 1,000 GPM is $5.33 U.S.
As Table 1 shows, a centrifugal water pump allowed to operate inefficiently without correction or intervention by the operator, can waste almost $9,900 per day, or $3.5 million per year for every 1,000 GPM of raw water moved. These figures also represent the energy savings with some operator training. This is how you can use the specific energy to your benefit.
Pumps and motors are by far the most popular pieces of rotating equipment in the world. The industrial pump far outnumbers compressors, fans, gearboxes, mixers, and other types of rotating equipment.
We’ve just calculated the energy costs of one typical raw water pump that might be in service today at any Texas municipal water department, or a West Virginia coal mine. We also calculated the specific energy, which reveals the kilowatts and lost dollars (close to $4 million in a year) from operating that pump away from best efficiency.
It’s a well-known fact that most process pumps languish between 10 percent to 40 percent efficiency simply because the operators and engineers lack proper training. These same pumps could be operating at 80 percent to 85 percent efficient with proper attention. If every family in Austin, Texas turns off one light to conserve energy, it won’t equal the savings of operating a handfull of industrial pumps at best efficiency.
I totally support new technology, and I know that some people are shopping for a new pump that might be 1 percent or 2 percent more efficient than the existing pumps in service now. I know some people are ready to purchase high efficiency motors and other high efficiency process devices to save energy. But if we invest in knowledge, we can conserve our way into the future and avoid an energy crisis. I mean, how many people can you train with $4 million? This is either the wasted energy or found savings from operating one industrial pump at best efficiency. Energy conserved is energy found.
Parting Shots
Piping systems are dynamic. This is the “D” in TDH. When the design engineer draws that triangle on the pump curve, he tells the process and production engineers that the pump will operate at one fixed point on the curve. I know this is true because I frequently meet with process, production and reliability engineers who are positive that their pumps are running at one fixed point (head/flow) on the curve.
Process engineers believe this with such conviction that they see no reason to install instrumentation (pressure gauges or flowmeters) on their pumps. Engineers tell me daily, “If I find a measurement worth making, I can justify the cost of installing the gauge or meter.”
This means cost isn’t the issue. If the engineer doesn’t install instrumentation on his pumps and doesn’t train the operators, then the engineer is either not convinced or not aware.
See the aforementioned pump curve and information on specific energy. How can a process or production engineer allow an inefficient, vibrating, overheating raw water pump to waste close to $10,000 U.S. per day in energy? Wouldn’t this money be better spent with an investment in instrumentation and training for the operators and technicians?
Your systems are dynamic if you work with process pumps, pipes, tanks, reactors, temperature, valves, pressure, filters, etc. Your systems are dynamic if you make soap, fuel, paper, beer, paint, glue, kerosene, sulfuric acid, or Jack Daniels. Your pumps are dragged all over the curve by the ever-changing system.
Learn how your pumps react to system changes and upsets. Install instrumentation on your pumps. Teach the operators to drive your pumps toward efficiency and reliability.
Larry Bachus, founder of pump services firm Bachus Company Inc., is a pump consultant, lecturer, and inventor based in Nashville, Tenn. He can be reached at [email protected].
